Abstract
Soybean is high quality protein source for resource poor families and oil crop in Ethiopia, but low phosphorus levels and soil acidity limit yields in the BunoBedele area. Therefore, the aim of this study is to investigate the effect of phosphorus fertilizer and different rhizobia strains on soybean performance in terms of growth, nodulation, and yield in Nitisol of southwestern Ethiopia. The experiment was conducted at BunoBedele, Ilkekerero sub site of Bedele Agricultural Research Center in 2023 main cropping season. The experiment included 16 treatment combinations four phosphorus levels (0, 10, 20 and 30 kg P ha-1), with and without inoculation MAR-1495 rhizobia, and two soybean varieties (Ketta and Cheri). The experimental design was Randomized Complete Block Design RCBD) in factorial arrangement with three replications. The Analysis of variance showed very high significant (P<0.0001) interactions between rhizobia inoculation and phosphorus levels, as well as variety (P<0.0001) effects on growth, nodulation, and yield. The highest yields were achieved (3.45 ton ha-1) with 30 kg P ha-1 and Rhizobium inoculation, particularly with the Ketta variety, while the lowest grain yield was observed 0.33 ton ha-1 under un-inoculated rhizobia and control plot of P application. The combined application of MAR-1495 rhizobia and 30 kg P ha-1 significantly improved nodulation and yield. This approach also resulted in the highest net benefits (113231.2 ETB) and marginal rate of return (541.6%), making it a profitable strategy for enhancing soybean production and farmer income in the region. The findings from this research provide several practical recommendations for optimizing soybean cultivation in environments similar to the one studied: Cultivar Selection and Fertilizer Management. By implementing these practical recommendations, farmers in similar environments can optimize their soybean cultivation practices and improve the productivity and profitability of their operations.
Introduction
Soybean (Glycine max (L.) Merrill) is one of the most important pulse crops and it belongs to the family (Leguminosae). Soybean is cultivated all over the world, as a major source of oil (20%) and protein (40%). Soybean is one of the most valuable crops in the world, due to its multiple uses as a source of livestock and aquaculture feed, protein and oil for the human diet (Ali et al., 2020). Beside, producing valuable grain, soybean fixes between 50-300 kg N ha-1 which makes a significant N contribution to inter-cropped and rotated cereal crops (Craswell and Vlek, 2013), estimated the improvement of maize crop following soybean crop at between 0.5 and 3.5 tons ha-1 or 30-350% relative to maize-maize sequences. The country's current foremost soybean-growing regions are located in the West and Southwest of the country. More than 44% of the country's soybean production is produced in the Oromia region, especially in the western and eastern areas of Wollega and Illu-ababor (Debela and Wogi, 2020). These regions have vast fertile land and favorable agricultural climate suitable for growing soybeans. In Ethiopia, an area of 75,938.88 hectares of land is planted with soybeans, producing 185,522.23 tons with a yield of 2.44 ton ha-1 (CSA, 2021/22), low compared to the world average of 2.74 ton ha-1 (USDA, 2021/22). In the Ethiopian region, production and fluctuations in two consecutive years (2021 and 2022) show the area from 83,613.66 ha to 75,938.88 ha, a decrease of 9.18%. Production 208,497.43 tons to 185,522.23 tons, changes 11.02%, and productivity from 2.49 ton ha-1 to 2.44 tons ha-1, down 2.04% compared to 2021 production area , output also decreased by 11.02% (CSA, 2021/22).
In Oromia Region an area of 4946.85 hectares of land is planted with soybeans, producing 10941.7 tons with a yield of 2.2 tons ha-1 (CSA, 2021/22), low compared to the worldwide and National average of 2.74 and 2.43 ton ha-1. In BunoBedele an area of 1,663 hectares of land is planted with soybeans, producing 3,448.5 tons with a yield of 2.07 tons ha-1 (Zone of BunoBedele Agricultural office, 2021/22), still low compared to the worldwide, national and regional average of 2.74, 2.44 and 2.2 ton ha-1.
In spite of the awesome potentials of the crop, soybean production is still insufficient owing to low yields, resulting in a wide gap between what is right now produced and what is needed. As a way of improving production level, one of the major areas to consider is the development of high yielding and improved varieties and development of improved cultural management practices. Soybean yield reduction resulting from soil acidity and other constraints is a significant issue in various regions, particularly in areas with high rainfall and acidic soils (Dabesa and Tana, 2021b). Here are some key points regarding the impact of soil acidity and other constraints on soybean yields: Soil acidity with associated low nutrient availability is a major constraint to soybean production in many regions, including southwestern Ethiopia. Soil pH levels below 5.0 can lead to high Al content, P fixation, and deficiencies in essential nutrients like Mg2+, Ca2+, and K+, which can significantly reduce soybean yields. Lime application can help alleviate these issues by increasing root and shoot yields, but high rates of lime application may not be economically feasible for resource-poor farmers. Other Constraints: Drought and water stress can also significantly impact soybean yields, particularly in areas with limited rainfall. Pests and diseases can further reduce yields if not managed effectively. Limited access to quality inputs, such as improved seeds and fertilizers, can also hinder optimal soybean production. Inadequate post-harvest handling, storage, and marketing infrastructure can lead to losses and reduce farmer income. Many of factors, such as Drought, soil acidity, soil fertility reduction, poor nutrient use, poor agronomic practices, and poor accessibility to quality seed, Pests, diseases and climate change affected soybean production (Koskey et al., 2017).
Soil acidity is a prevalent problem in the Ethiopian highlands, affecting soil productivity and crop yields. Acidic soils cover a substantial portion of arable land in Ethiopia, with the western part of the country being particularly affected (Gurmessa, 2021a). Factors contributing to soil acidity in Ethiopia include heavy rainfall, high temperatures, erosion of topsoil, and improper agricultural practices that lead to the degradation of organic matter and leaching of essential nutrients from the soil (Beyene et al., 2023). Acidic soils in Ethiopia are inherently infertile and often exhibit aluminum or manganese toxicity, which hinders plant growth and reduces crop productivity. The low pH of acidic soils affects nutrient availability, especially phosphorus and other macronutrients, essential for plant growth. Approximately 43% of the Ethiopian arable land has influenced by soil acidity, of these about 28.1% of soils were dominated by strongly acidic soils (pH 4.1-5.5) (Bekana et al., 2022). Correcting soil acidity through liming can improve soybean yields, but high rates of lime application may not be economically feasible for resource-poor farmers. Selecting soybean varieties tolerant to soil acidity and phosphorus deficiency can help mitigate these constraints. Integrated soil management options, such as micro-dosing lime application, can improve soil physical and chemical properties and enhance crop production. Proper agronomic practices, including row planting and timely fertilizer application, can also enhance soybean yields
The establishment of an effective and efficient BNF depends on optimizing all of the components (i.e. legume Rhizobium, management and environment) together. An understanding of the effects of these management factors on the symbiosis may assist in the selection of P-efficient soybean genotypes that will enhance symbiotic nitrogen fixation and soybean yield. Phosphorus is an essential ingredient for Rhizobia bacteria to carry out BNF processes. Insufficient P restricts root development, the process of photosynthesis, translocation of sugars and other such functions, which directly impact N fixation by legume plants. The phosphorus serves as an energy source during the physiological processes taking place in the plant (Karthika et al., 2018). Therefore, this study was aims to investigate the effect of phosphorus fertilizer and rhizobia strains on soybean performance in terms of growth, nodulation, and yield in Nitisols of southwestern Ethiopia. The findings of this research was contribute to the development of sustainable agricultural practices, including optimized phosphorus management and the identification of suitable rhizobia strains, to enhance soybean production in Nitisols of southwestern Ethiopia.
Material and Methods
Description of the study area
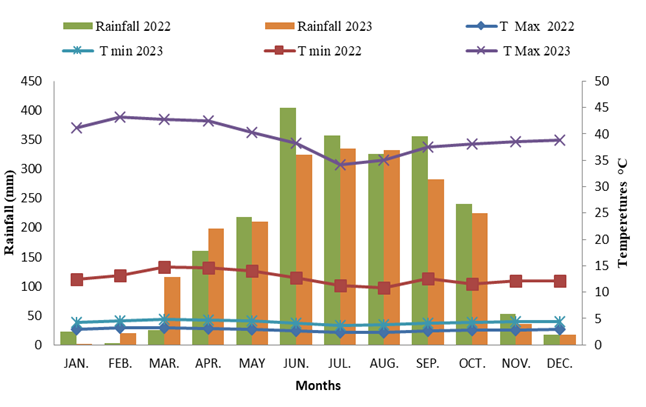
The experiment was conducted in the Bedele district, of Oromia regional state, Southwestern Ethiopia in the 2023 main cropping season. The district is located between 8°14′30″N and 8°37′53″N latitude and 36°13′17″E to 36°35′05″E longitude (Fig. 1).The area is situated at about 480 km Southwest of Addis Ababa, Ethiopia, and the elevation of the study area ranges from 1013 to 2390 m.a.s.l. The experimental site has a sub- humid climate of 13.1°C and 26.5°C, minimum and maximum annual temperatures, respectively. The area receives an annual rainfall of 2097.6 mm with maximum precipitation from April to October (Bedele National Metrology Station, 2022/2023) (Fig. 2). The area is characterized by a rugged topography dominated by gentle slopes and localized steep slopes ranging from 2 to 45%. The predominant soil types are Nitisols, Luvisols and Cambisols in the plateau and side slopes and Vertisols in low land (Regassa et al., 2023). The soil acidity of the study area ranged from slightly acidic to very strongly acidic with pH values of 4.5 to 6.8 and the available P (ppm) content of nearly 80.23% of the soils was in the very low (< 5) and low (5-10) categories (Gedefa et al., 2021). Mixed farming is the main agricultural activity carried out in the area. The main livelihood strategies in the district include crop production, livestock rearing, and off-farm activities. The major crops grown in the district includes maize (Zea-maize), wheat (Tritium aestivum), sorghum (Sorghum bicolor), finger millet (Eleusine coracana), coffee (Coffee arabica L.), and teff (Eragrotis abyssinica). Pulse crops such as faba bean (Vicia faba) and field peas (Pisum sativum) are also grown in selected areas. Generally, the study area covered a total area of 74468.50 hectares of land (Huluka et al., 2018).
Experimental materials
The study has used soybean Varieties named as: Ketta and Cheri obtained from BeARC. Table 1 shows brief description of the varieties.
Experimental design and procedure
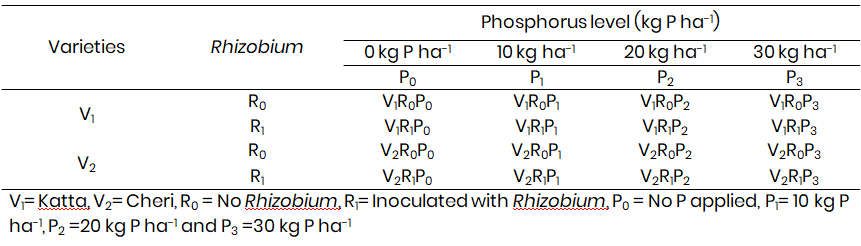
The field experiment was laid out in factorial randomized complete block design (RCBD) with three replications (Table 2). The treatments were consists of two cultivars, four different P rates (0, 10, 20, and 30 kg ha-1) and two levels of BradyRhizobium (un-inoculated and inoculated with MAR-149). Therefore, this experiment consists of 16 treatments and replicated 3 times. A total of 48 plots. The size of each experimental plot was 4.2 m × 2 m (8.4 m²), with distances between plants, rows, plots, and blocks of 5 cm, 60 cm, 0.5 m, and 1 m, respectively, for a total area of 576.7 m². The seeds were weighed on an electronic scale and soaked in a sugar solution. BradyRhizobium strain (MAR-1495) was applied to the moistened seeds at a rate of 10 g kg-1 seeds. The BradyRhizobium inoculum was thoroughly mixed with the seeds. Seeds were air-dried in the shade for 30 min to maintain cell viability and then sown within 1 hour at the required rate and spacing.
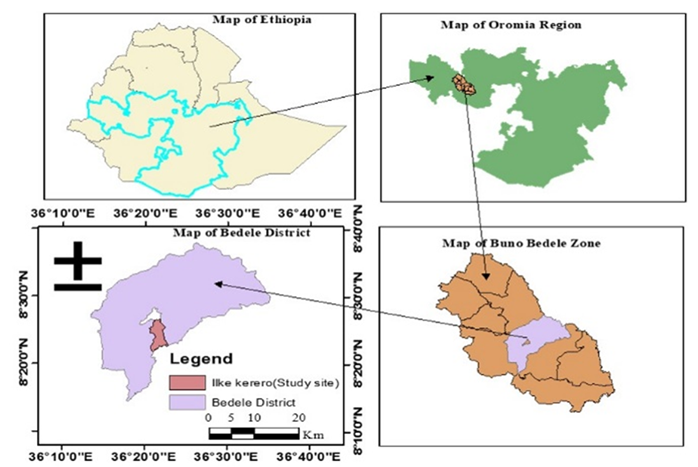
Fig. 1: Location map of the study area
Table 1: Varieties characteristics
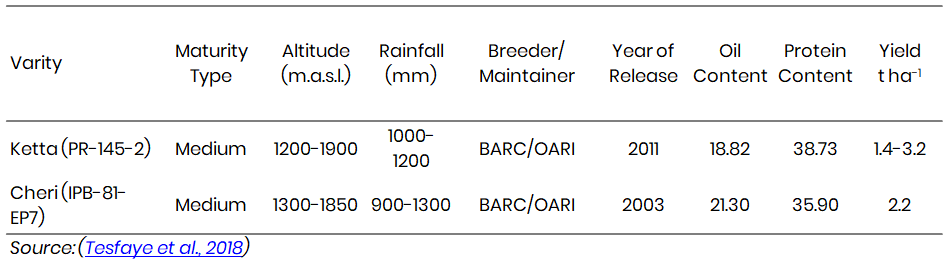
Table 2: Treatments combination arrangement
Soil sampling and analysis
Before planting, representative soil samples were randomly collected from eight test plots at depths of 0-20 cm using an auger. Finally, composite samples were prepared for analysis to determine the physicochemical properties of the soil experimental site. A 1 kg composite sample was prepared and brought to the soil laboratory of the Bedele Agricultural Research Center in labeled polythene bags. The soil samples were air-dried, ground, and sieved through a 2-mm sieve to analyze soil texture, pH, available phosphorus, and cation exchange capacity (CEC), and the soil samples were ground to a sieve size of 0.5 mm. Soil organic carbon content was determined by the Walkley and Black (1934) as described in the FAO (2006) Laboratory Guide for Plant Nutrient Analysis (Pineiro et al., 2008). Soil texture was measured using the hydrometer method (Bouyoucos, 1951).
Soil pH was measured in water using a potentiometric pH meter and a glass electrode connected to a digital pH meter at a soil-to-water ratio of 1:2.5 (Pineiro et al., 2008).Total nitrogen was measured using the Kjeldahl method (Jackson, 1967). Available soil phosphorus was extracted and measured by spectrometer using the Olsen method Holford and Cullis (1985). Cation exchange capacity (CEC) was determined by using ammonium acetate method (Miller and Wolin, 1982). After soybean harvest, representative soil samples were randomly collected in a V-shape at two to three locations in each experimental plot using an auger at a depth of 0 to 20 cm. Finally, plot-based samples were prepared for analysis to determine the effects of treatments on selected soil chemical properties at the experimental sites. The collected soil samples were air-dried, ground, and sieved with a mesh size of 2 mm. Samples were prepared, placed in polyethylene bags, labeled, and sent for analysis of available phosphorus, total nitrogen, organic carbon, and soil pH using the same procedures described above.
Land preparation and planting
The site was cleared using a tractor in April 2023. A field which was cropped to finger millet in the previous season plowed to a depth of 0-20 cm to create fine seedbeds and leveled by hand before field layout. A fine seedbed is prepared according to the design, the field layout is prepared, and each treatment is randomly assigned to experimental units within a block. The soybean was planted on June 26, 2023; with a 60 cm inter row spacing and a 5 cm between intra row spacing. As a precaution to avoid cross-contamination, the non-inoculated treatment was planted first followed by the inoculated treatment. This experiment was conducted under rain-fed conditions.
Management of the experiment
The inoculated seeds of each treatment were sown by one individual, Ridges were made to prevent the spread of bacteria due to rainwater on the site and within the city block, weed managements, followed, and data recorded was carried out during the growing season. In the experimental field, weeding was performed during the growing season.
Data collected
Phenological parameters
Days to 50% flowering: Record the number of days from emergence until 50% of the plants in the plot have at least one flower.
Days to 90% physiological maturity: Number of days from emergence until 95% of plants in each net plot show yellow color and pods turn yellow before senescence is recorded.
Nodulation parameters
Total number of nodules: Nodule and root characteristics were measured by carefully uprooting five randomly selected plants from each plot along with the soil during the time of flowering.
Root volume: The root samples of five plants were collected and immersed carefully in 1000 ml capacity plastic cylinder, which is filled up with water to a volume of 100ml. The volume of water displaced by the roots was recorded as root volume per plant.
Tap root length: The tap root length of five randomly selected plants was measured and the average of the root lengths was recorded.
Total Number of effective nodule: Deep dark red, slightly dark red and pink nodules were considered effective for nitrogen fixation. On the other hand, green or white ones may be considered ineffective. The percentage of effective nodules (%) was then calculated.
Nodule fresh weight (g per plant): Root nodules were collected from five plants, and weighed, and the average fresh weight of the nodules was recorded.
Nodule dry weight (gm. per plant): The nodules were dried in an oven at 70 °C for 48 h to constant weight. The dry nodule weight was then measured and the average nodule dry weight was recorded.
Growth parameter
Leaf area: This is measured at physiological maturity in five randomly selected marked plants. Five plants were randomly sampled from each plant to represent the lower, middle, and upper parts. Then measure the length and width with a ruler in centimeters, multiply the width by the length and the correction factor to get the area of each leaf, and applying the equation LA = a × (L × W), where LA is the leaf area (cm2), L is the leaf length (cm), W is the largest leaf width (cm), and a is the angular coefficient (2.0185) (Turek et al., 2023).
|
Leaf area index = |
Leaf area |
------- (1) |
|
Ground cover |
Leaf Area Index: The leaf area index was calculated using the relation
The plant height: Plant height was measured from the ground to the highest tip of the stem for five randomly selected plants per plot at physiological maturity before harvest. Average plant height (cm) was calculated for each treatment.
Number of primary branches: This was measured during the sampling period and at physiological maturity when all plants stopped growing. We counted the branches of the five plants sampled from each plot and calculated the average.
Yield and yield components
Number of pods per plant (count): Counts were made from five randomly selected plants from the middle three rows at maturity and expressed as the average for each plant.
Number of seeds per plant (count): Counts were made from five randomly selected plants from the central row at maturity and expressed as the average of the five plants.
Hundred seed weight (g): The harvested seeds per net plot were randomly counted and weighed (g) using an electronic balance at a seed moisture (GT PRO) content of 12.5% standard moisture content for soybean crops.
Grain yield: It was measured by harvesting the crop from the three central rows of the net plot area.
Above ground biomass: The total aboveground biomass of the net plot area in the middle three rows was determined by harvesting at physiological maturity near the soil surface and drying in the sun to constant weight. Finally, the net plant plot area biomass yield was converted to per hectare and expressed in tons ha-1.
Harvest index (%): The harvest index per plot was recorded as the ratio of grain yield to soil biomass yield of or more per plot. Calculated using flow equation:

Where HI = harvest Index, GY = Grain Yield (kg), BY = Biological Yield (kg)
Phosphorus uptake efficiency
Phosphorous is essential to crop production; it stimulates early root formation and growth, gives a rapid and vigorous start to plants, and promotes flower and seed production. Phosphorous is needed in the genetic coding material, which controls cell division. The P content in plants is usually between 0.1 to 0.5% of the dry matter. Total P in plant material can be attained either by wet-digestion procedure or by dry-ashing procedure. Both methods are satisfactory. However, dry-ashing is a simpler, easier, non-hazardous and economical option. Later, P content in the digests or dissolved ash aliquots is measured spectrometer. Dry ashing is appropriate for analyzing P, but only in plant tissues containing low silica contents (like legumes). The procedure is slight modifications (Pratt and Chapman, 1961).
Dry-ashing procedure
- Weigh 0.5-1.0 g dry and ground plant material in a 30-50 mL porcelain crucibles or Pyrex glass beakers.
- Place porcelain crucibles into a cool muffle furnace, and increase temperature gradually to 550 °C.
- Continue ashing for 5 hours after attaining 550 °C.
- Shut off the muffle furnace and open the door cautiously for rapid cooling.
- When cool, take out the porcelain crucibles carefully.
- Dissolve the cooled ash in 5-mL portions 2 N HCl and mix with a plastic rod.
- After 15-20 minutes, bring to the volume (usually to 50-mL) using DI water.
- Mix thoroughly, allow standing for about 30 minutes, and use the supernatant or filter
- Through Whatman No. 42 filter paper, discarding the first portions of the filtrates.
- Analyze the aliquots for P by spectrometer (by Ammonium Vanadate-Ammonium Molybdate yellow color method).
Phosphorus uptake efficiency (PUE) was calculated using the formula of (Fituma, 2015).
PUE=P concentration× drybiomass yield--------(3)
Agronomic efficiency (AE) is defined as the grain yield per unit of fertilization.

Where, Gf is the grain yield (kg) in the fertilized area, and GU is the grain yield in the fertilized area. Unfertilized area (kg), Na is the amount of P applied (kg).
Partial budget analysis
Economically acceptable treatments were determined through a partial budget analysis that estimated total grain yield using adjusted yield to grain market value and growing season inputs. Only the total variable cost (TCV) was used to calculate costs. The current prices of soybeans, inoculants, and P, as well as the costs of applying inoculation and P, were considered to vary according to their costs. To estimate the economic parameters, soybean yield was valued at an average market price of birr kg-1. To compare soybean yields with the yields farmers receive, the achieved yields have been revised downward by 10%. Both costs and benefits were converted to Ethiopian Birr (ETB) amounts and reported per hectare. Net treatment benefits (NB) and TCV were compared using a two-step superiority analysis described below. The first step was to calculate NB as shown in the following formula suggested by CMMITY Program, (1988).
NB = (GY×P)-TCV, (1) where GY × P is the total field benefit (GFB), GY is adjusted profit. Grain yield per hectare, P is the field price per unit of harvest. Second, beneficial TCVs were listed in ascending order according to dominance analysis. All treatments with NB below the low TCV treatment were marked with the letter “D” for being dominant and excluded from further analysis. Non-dominant treatments were subjected to marginal return (MRR) analysis.
Results and Discussion
Soil physico-chemical properties before Soybean planting
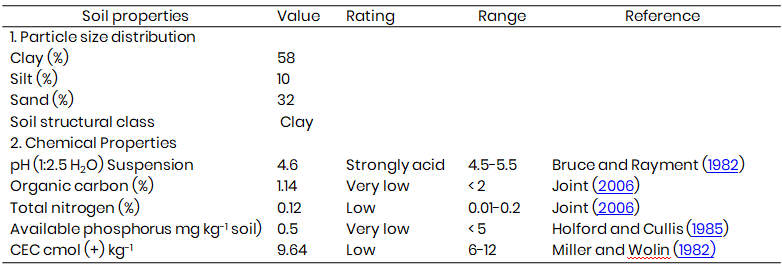
The results of the analysis of selected physicochemical properties indicate that the particle size distribution of the soil is dominated by clay (58%) followed by sand (32%), and silt (10%) (Table 3). Accordingly, the textural class of soil of experimental site was clay. Soybean produced a high yield in loamy textured soil, but it can also grow well in clay soils (Butcher et al., 2018). The soil pH of experimental site was 4.6, which is strongly acidic according to (Bruce and Rayment, 1982).
Soybean has been found to grow well in pH values of 5.5-7.0 and any pH below and above these values will affect its growth and thus such soil needs amendment to neutralize the extreme soil reactions (Gordon et al., 2022). Chemical reaction like total N, available P, OC, and CEC of the soil before planting were 0.12%, 0.5 mg kg-1, 1.14%, and 9.64 cmol (+) kg-1, respectively (Table 3). The soil had low total N content based on the classification of total N content (%) (Joint, 2006). Moreover, the study site had very low available P content (Table 3) according to classification of Holford and Cullis (1985). The organic carbon content of the soil before planting was 1.14% indicating as very low (Table 3) according to (Joint, 2006) rating. The cation exchange capacity (CEC) of the soil was 9.64 cmol (+) kg-1 which is in the low range (Table 3) according to (USDA, 2007).
Generally, the soil analysis revealed that the soil sample is predominantly clay with a strong acidic pH, very low organic carbon content, low total nitrogen content, very low available phosphorus, and a low in cation exchange capacity (CEC) level. This result was in line with the findings of (Gedefa et al., 2021), who mapped the spatial distribution of soil properties in the study area and found that 62.61%) of the soils had strongly acidic (pH < 5.5), 73.39% had low OC content (2-4%), and 80.23% of the available P (ppm) content was categorized between low (5-10) and very low (< 5). Understanding these soil properties is crucial for making informed decisions regarding soil management practices, nutrient amendments, and crop selection to optimize agricultural productivity in this specific soil type.
Table 3: Effect of P fertilizer rate, Rhizobium inoculation and varieties on selected soil chemical properties before Soy
Effect of P fertilizer rate, Rhizobium inoculation and Soybean varieties on selected soil chemical properties after harvest
Soil pH
The interaction of variety×fertilizer×Rhizobium inoculation showed non-significant effect on soil pH (Appendix Table 1).The main effect of P fertilizer, Rhizobium inoculation and soybean varieties had very highly significant (P<0.001) influence on soil pH. On the other hand, the soil pH value of the experimental site increased by 5.13% over initial soil pH value of the experimental site increased by 5.13% over initial soil pH of 4.6%. The increment in soil pH by 5.13% over initial pH because of application of phosphorus at 30 kg ha-1 with Rhizobium inoculation might be ascribed to the impact of organic matter on soil pH through formation of complexes with acid forming cation such as Al and Fe. The highest soil pH value 4.82 was recorded at T4 received 30 kg P ha-1 with Rhizobium inoculation, while the lowest soil pH 4.64 was recorded T1 received control plot of P application and uninoculated (Table 4). Even though a slight increment was observed in strongly acidic (Bruce and Rayment, 1982).
Soil organic carbon
Analysis of variance indicated very highly significant (P<0.0001) main effect of P application, Rhizobium inoculation and Varieties on soil organic carbon (Appendix Table 1). However, the three factor interactions effect of P×V×Rh also had non-significant influences on soil organic carbon content of the experimental site (Appendix Table 1). The average organic carbon content of soil of each plot after harvesting was about 66.67% higher than the initial organic carbon content 3.51% (Table 4). The increased of organic carbon by 66.67% over initial soil organic carbon 3.51% content of the experimental site might be associated with the improvement of soil conditions, which might be enhanced biomass production, proliferation of soil microbial and their activity in the soil. An average organic carbon content of each treatment after harvesting was 8.4% higher than the initial organic carbon content of the soil at Bako (Dabesa and Tana, 2021a). This result is in agreement with the findings that the attributed increase in soil organic carbon to the dropping of leaves, which added organic carbon to the soil (Tisdall, 2020).
Total nitrogen
Analysis of variance indicated very highly significant (P < 0.0001) main effects of Rhizobium inoculation, P application rate and Varieties on total nitrogen content of the soil after harvesting of the soybean (Appendix Table 1). Also, the three factor interactions of P×V×Rh had non-significant (P > 0.05) effect on total nitrogen of the experimental site. The highest total nitrogen content 0.28% was recorded from plots that received Phosphorus application at 30 kg ha-1 and Rhizobium inoculation, while the lowest total nitrogen 0.18% was recorded for plots that received control plot of P application and un-inoculated plot (Table 4). The increment in total nitrogen content of the soil due to phosphorus application with Rhizobium inoculation might be due to increase of the organic matter content of the soil and still found in medium class according to (Joint, 2006). The total nitrogen content of the soil increased from 13.48% by Phosphorus application at 30 kg ha-1 and Rhizobium inoculation over the control at AlichoWuriro Highland Ethiopia (Woldekiros et al., 2018). Furthermore, the release of N from the applied phosphorus with Rhizobium might have contributed to the increase in total nitrogen, and soybean leaf dropped may also increase the Nitrogen.
Available phosphorus
The main effect of P fertilizer, varieties and Rhizobium inoculation had significant (P<0.05) effect on available soil phosphorous. However, the three factor interactions of P×V×Rh showed non-significant effect on soil available P (Appendix Table 1).
The highest soil available P content was recorded 0.82 mg ka-1 from the plots treated with 30 kg P ha-1 inoculated with Rhizobium with MAR-1495 strain followed by 20 kg P ha-1 with Rhizobium inoculated, while the lowest soil available P content was recorded 0.41 mg kg-1. From the control plot of P application rate and un-inoculated Rhizobium (Table 4). Available phosphorus recorded at 30 kg P ha-1 with Rhizobium inoculated and control plot of P application and without Rhizobium inoculated are still in very low rating according to (Holford and Cullis, 1985). This result indicated integrated use of high rate of P fertilizer with Rhizobium inoculated significantly increased available phosphorus even if it was in medium rate according to Holford and Cullis, (1985). In general, at low P fertilizer rate and its combination with Rhizobium inoculation increased the available P content of the soil after harvest of soybean from the initial soil available P content (0.82 mg kg-1 of soil) (Table 4). This could be due to the fact that P is a key requirement for ATP production during the process of biological nitrogen fixation (Dabessa et al., 2018).
Effect of BradyRhizobium inoculation and P application rate on phenology of Soybean varieties
Flowering days
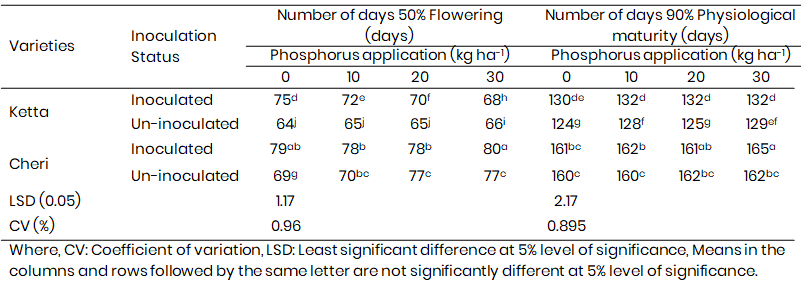
For the variety Ketta, the number of days to 50% flowering decreased with increasing phosphorus application rates for inoculated conditions. The lowest number of days to 50% flowering was observed 68 days at 30 kg ha-1 P for both inoculated and un-inoculated treatments. For the variety Cheri, a similar trend was observed with an increase in the number of days to 50% flowering with increasing phosphorus application rates for inoculated conditions. The highest number of days to 50% flowering was observed 80 days at 30 kg ha-1 P for both inoculated and un-inoculated treatments (Table 5).
The study revealed that rhizobia inoculation delayed the number of days to flowering, which suggests that inoculation, had influence on days to 50% flowering. The prolonged days to flowering could be due to the rhizobia inoculation that facilitated nitrogen fixation and enhanced vegetative growth, which in turn extended the flowering date. Nitrogen produced by biological nitrogen fixation, as part of the protein compound, enzyme and effective compound in energy transfer takes part in the structure of DNA, in the structure of chlorophyll, and direct impact on vegetative growth (Bhatla and Lal, 2023). Soybean inoculation increased the leaf chlorophyll content and plant biomass, and the leaf chlorophyll content of the plant remained at high levels until, the pod filling stage, as a result of delays in days to flowering (Grassini et al., 2021). This result is in agreement that inoculation induced late flowering in soybean in both glasshouse and field experiments (Adeyemi et al., 2020). This might be due to sufficient nitrogen produced by N2 fixation promoted vegetative growth, which in turn extended days to flowering.
Phosphorus application was significantly (P=0.022) affected days to flowering. This could be due to the presence of adequate P applied to enhance shoot, root growth, and promote early flowering. Similarly, reported though the effect of P was significant, P application has slightly reduced the days to 50% flowering on soybean bean as P rate increased (Adjei-Nsiah et al., 2019). The three ways of interaction were significantly influenced on days 50% flowering. The significant effect of inoculation of BradyRhizobium japonicum and Phosphate Solubilizing Pseudomonas spp on days to 50% flowering (Irankhah et al., 2021).
Days to 90% physiological maturity
For both varieties, the number of days to reach 90% physiological maturity varied with phosphorus application rates and inoculation status. In general, there was no consistent trend across all treatments for both varieties. Comparison between Inoculated and Un-inoculated Treatments In general, there were differences in the number of days to reach 50% flowering and 90% physiological maturity between inoculated and un-inoculated treatments for both varieties across different phosphorus application rates. Cheri variety at 30 kg ha-1 P application and with the inoculation of Rhizobium bacteria was the latest matured with 165 days to maturity; while the earliest matured (124 days to maturity) variety was Ketta, with Rhizobia un-inoculation and control plot of P application (Table 5).
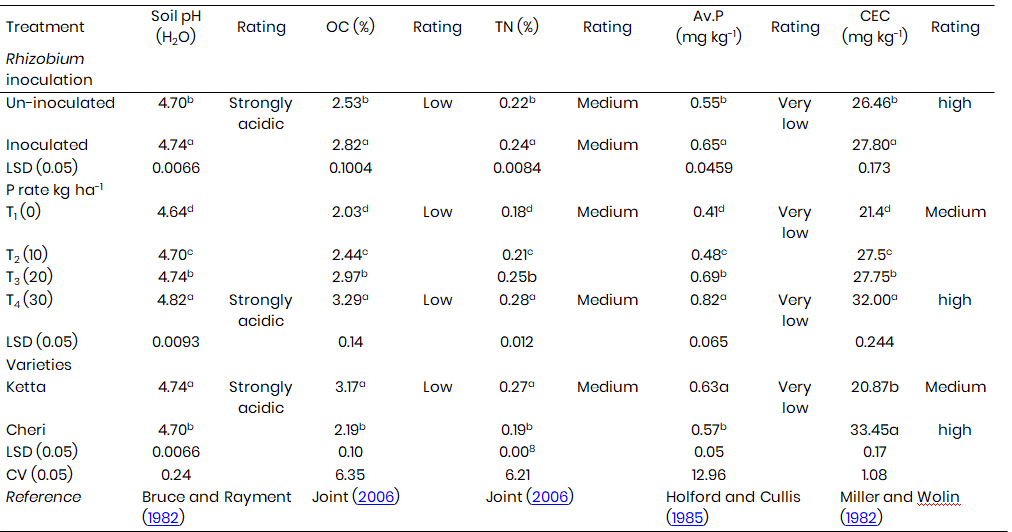
Table 4: Effect of P fertilizer rate, Rhizobium inoculation and varieties on selected soil chemical properties
Table 5: Responses of two soybean varieties to rhizobia inoculation and rate of phosphorus application for flowering date and 90% days to p
The result revealed that days to maturity delayed in response to phosphate fertilizer application relative to control plot (Table 5). This might be due to the important role of phosphorus, as the vital component of adenosine triphosphate (ATP). Soybean needs phosphorus for adequate growth and nitrogen fixation. Sufficient phosphorus levels are also required to enhance different plant organs growth and promote nodulation and early maturity (Malhotra et al., 2018). Phosphorus is a very important nutrient for plant cell division, growth and root lengthening, seed and fruit development, and early ripening, as well. In line the observed the phosphorus is known for its effect to promote maturity. The other reason for hastening maturity could be due to the mobilization of leaf nitrogen to the reproductive organs for development (Snider et al., 2021).
Soybean maturity was delayed by a result of inoculation rhizobia. The delay in maturity of soybean might be because the N2 fixed by inoculation promoted vegetative growth the crop. Similarly, inoculation enabled soybean to display better growth and increase in days to maturity (Kumawat et al., 2019). The interaction between the varieties, inoculation and p application did not significantly (P=0.0602) influenced days to physiological maturity.
Effect of Bradyrhizobium inoculation and P application rate on growth of Soybean varieties
Leaf area
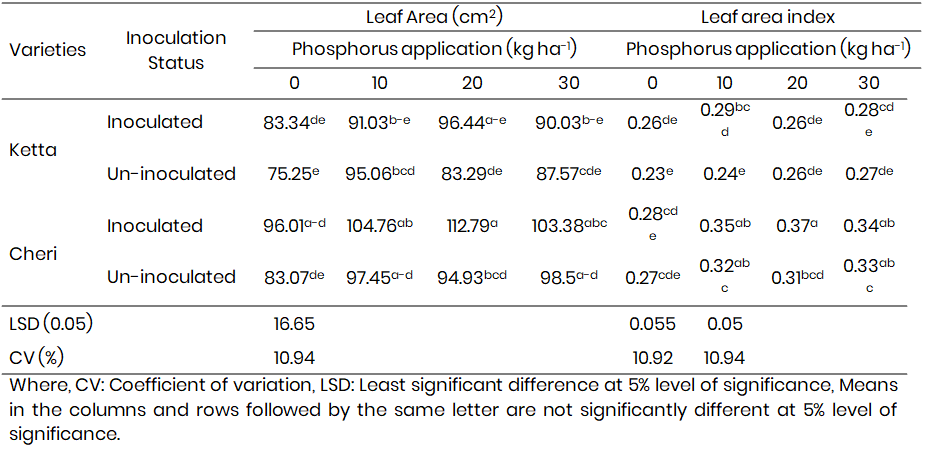
For the variety Ketta, in the inoculated condition, the leaf area increased with increasing phosphorus application rates up to 20 kg ha-1 P and then slightly decreased at 30 kg ha-1 P. The highest leaf area was observed 96.44 cm2 at 20 kg ha-1 P. In the un-inoculated condition, a similar trend was observed, with the highest leaf area 95.06 cm2 at 10 kg ha-1 phosphorus. For the variety Cheri, in both inoculated and un-inoculated conditions, the leaf area increased with increasing phosphorus application rates. The highest leaf area was observed 112.79 cm2 at 20 kg ha-1 P for both inoculated and un-inoculated treatments (Table 6). The lowest leaf area was produced by the variety Ketta (75.25 cm2) under the control plot of P application and no rhizobia inoculation. The top variety showed 33.35% leaf area increases over the genotype that produced the lowest leaf area.
This finding is in agreements the early maturing soybean genotypes achieve minimum leaf area values required for maximum potential yield at the early reproductive growth stage (Lopez et al., 2021). Phosphate is also very important for leaf expansion, increase in leaf surface area and higher number of leaves. Phosphate application has been reported to increase shoot growth and leaf growth of soybean and other leguminous crops (Akpalu et al., 2014). Reduction in phosphate supplementation resulted in decrease in shoot growth, specifically in leaf size. A reduction in leaf area with decrease phosphate fertilizer implied changes in leaf initiation rates and activity of shoot apical meristem. Decreased size of individual leaves could be related to changes in either cell division or cell expansion of both (Chiera et al., 2002).
Leaf area index
For the Ketta variety: Inoculated plants had higher leaf area index values compared to un-inoculated plants across all phosphorus application levels. The highest leaf area index for the Ketta variety was observed (0.29) at a phosphorus application level of 10 kg ha-1 for both inoculated and un-inoculated plants. The differences in leaf area index between phosphorus applications levels were more pronounced in inoculated plants compared to un-inoculated plants.
For the Cheri variety: Inoculated plants generally exhibited higher leaf area index values compared to un-inoculated plants. The highest leaf area index for the Cheri variety was observed 0.37 at a phosphorus application level of 20 kg ha-1 for inoculated plants. The differences in leaf area index between phosphorus application levels were more consistent compared to the Ketta variety.
Generally, the results suggest that phosphorus application has a significant effect on leaf area index, with variations depending on the variety and inoculation status. Inoculated plants generally showed higher leaf area index values, indicating a positive impact of inoculation on plant growth in response to phosphorus application.
This findings is in agreements that inoculation and phosphorus application levels play a significant role in influencing leaf area index (Adeyemi et al., 2021), with differences observed between inoculated and un-inoculated plants as well as variations in response to different phosphorus levels.
Table 6: Responses of two soybean varieties to rhizobia inoculation and phosphorus application rate for leaf a
Plant height
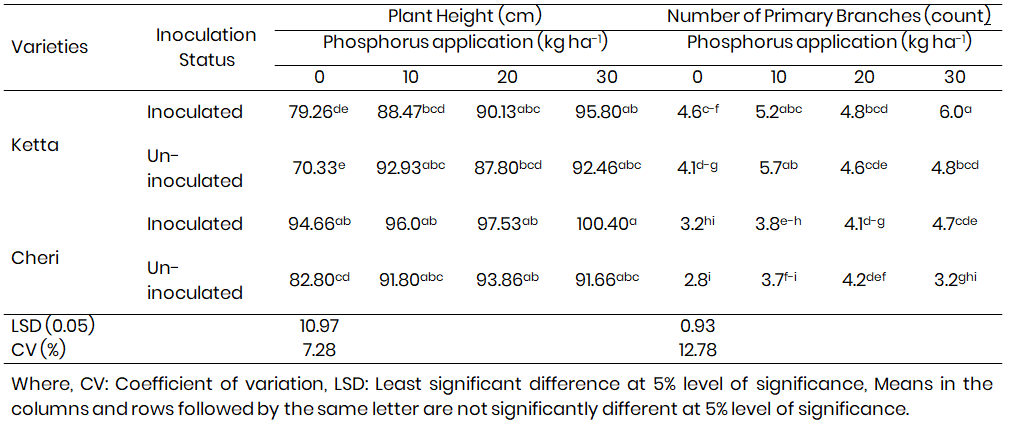
For the variety Ketta, inoculated plants generally had higher plant heights compared to un-inoculated plants at all levels of phosphorus application. The difference in plant height between inoculated and un-inoculated plants was statistically significant (indicated by different letters) at most phosphorus application levels. The highest plant height for Ketta was observed in the inoculated group 95.80 cm at 30 kg ha-1 phosphorus application. For the variety Cheri, inoculated plants also showed higher plant heights compared to un-inoculated plants at most levels of phosphorus application. There were statistically significant differences in plant height between inoculated and un-inoculated plants at some phosphorus application levels. The highest plant height for Cheri was observed in the inoculated group 100.40 cm at 30 kg ha-1 phosphorus application. The shortest plant height of 70.33 cm was found with Ketta variety under no Rhizobia inoculation and control plot of P application (Table 7). Therefore, it can be concluded that inoculation and appropriate phosphorus application can positively influence plant growth in these varieties.
A linear increase in plant height was observed with the advancement in age of all the soybean varieties. The plant height became slow till maturity stage, which might be due to the fact that the plant converted from the vegetative to reproductive phase of growth and development. Thus, it was also observed from the data that the increase in plant height continued up to maturity stage. Phosphorus application affected the height of soybean. It was found that P application at the rate of 10, 20 and 30 kg P ha-1 significantly increased plant height of rhizobia inoculated soybean by 29.37, 30.48 and 29.17 % with inoculated respectively over the control plot of P application. Also, phosphate solubilizing fungi inoculated soybean plants scored significantly higher plant heights, which was 81% over the un-inoculated treatment (Argaw, 2012). This finding is in agreement phosphorus application of 60, 120 and 180 mg P kg-1 significantly influenced soybean height (Imenu et al., 2022). The increase in plant height, due to increase phosphorus application, might be attributed to pronounced vegetative growth in response to the applied P (Amanullah et al., 2019).
Number of primary branches
For the variety Ketta, in both inoculated and un-inoculated conditions, the number of primary branches increased with increasing phosphorus application rates. The highest number of primary branches was observed six at 30 kg ha-1 P for both inoculated and un-inoculated treatments. For the variety Cheri, a similar trend was observed with an increase in the number of primary branches with increasing phosphorus application rates for both inoculated and un-inoculated conditions (Table 7).
The lowest number of primary branch was recorded by the variety Cheri (2.8) under the control plot of P application and no rhizobia inoculation. The variety that produced the highest number of primary branch showed more than 53.3% increases over the lowest variety. There was significant effect on number of primary branches because of Bradyrhizobium inoculation or phosphorus application and their interaction (P=0.05). Similarly, the number of primary branches was significantly influenced by the application of Bradyrhizobium inoculation, phosphorus, and their combined effect (Dabesa and Tana, 2021a). The number of branches per plant was significantly affected by different rates of phosphorus application and this might probably be due to the cumulative effect of phosphorus on the process of cell division and balanced nutrition. Dissimilar report: The effect of Bradyrhizobium inoculation and phosphorus application on the number of primary branches was not statistically significant (Musa et al., 2018).
Table 7: Responses of two soybean varieties to rhizobia inoculation and rate of phosphorus application for pla
Effect of Bradyrhizobium inoculation and P application rate on nodulation of Soybean varieties
Number of nodule plant-1
For the variety Ketta, inoculated plants generally had a higher number of nodules per plant compared to un-inoculated plants across all levels of phosphorus application. The difference in the number of nodules between inoculated and un-inoculated plants was statistically significant at most phosphorus application levels. The highest number of nodules for Ketta was observed in the inoculated group 31.80 at 30 kg ha-1 phosphorus application (Fig. 3a), which is due to rhizobia inoculation and phosphorus application increases the number of nodule per plants by attributing nodule formation and nitrogen fixation of basic energy transfer of phosphorus. For the variety Cheri, a similar trend was observed with inoculated plants having a higher number of nodules compared to un-inoculated plants at most phosphorus application levels. The difference in the number of nodules between inoculated and un-inoculated plants was statistically significant at some phosphorus application levels. The highest number of nodules for Cheri was observed in the inoculated group 25.6 at 20 kg ha-1 phosphorus application. The lowest number of nodules per plant (16.33) was recorded on the variety Cheri with no inoculation of rhizobia, and the control plot of P application (no application of P) (Fig. 3b), which showed about 94.73% decrease over the variety that produced the highest number of nodules. Likewise the application of P fertilizer at the rates of 0, 50, 100 and 150 kg P2O5 ha-1 significantly increased number of nodules (Houngnandan et al., 2020). Also an increased number of nodules per plant under the highest rate of phosphorus (30 kg P ha-1) Rhizobium inoculation. Phosphate application increased the activity of rhizobia, which might have intern increased the formation of root nodule. Plant tissue develops around the infected area, forming the nodule and site for the bacterial growth, which creates environment for the fixation of elemental nitrogen from the soil. Correspondingly, the application of 46 kg ha-1 P2O5 and inoculation of Rhizobium japonicum significantly increased the number of nodules per plant by 240.7% and 123%, respectively (Tarekegn and Kibret, 2017). This result was in collaborate with the application of Bradyrhizobium japonicum strain USDA110 and 60 kg of P2O5 enhanced the number of nodule per plant (Houngnandan et al., 2020).
Effective nodule
Nodule effectiveness refers to the efficiency of nodules in fixing nitrogen. Higher values indicate better nitrogen fixation. For both varieties, inoculated plants generally showed higher nodule effectiveness compared to un-inoculated plants at most levels of phosphorus application. The difference in nodule effectiveness between inoculated and un-inoculated plants was statistically significant at some phosphorus application levels. The highest nodule effectiveness for both varieties was observed in the inoculated group 13.66 and 10.80 at 30 kg ha-1 phosphorus application respectively. Phosphorus application affected the effective nodule of soybean. It was found that P application at the rate of 30 kg P ha-1 significantly increased effective nodule of rhizobia inoculated soybean by 90.26, and 87.69% with inoculated respectively over the control plot of P application. The lowest number of effective nodules was produced by the variety Cheri (1.33) under un-inoculated and the control plot of P application conditions (Fig. 4a and 4b). Nodules with deep dark red, slightly dark red and pink were considered effective and fixing nitrogen and typically of healthy and effective was due to presence of leghemoglobin protein responsible for oxygen binding (Kasper, 2019). In addition, other reported legume nodules having dark pink or red centers (due to leg hemoglobin presence) are an indication for effectiveness of the strain used and positively correlated with higher N2 fixation (Meleta and Abera, 2019). This is due to compatibility between rhizobia inoculation and host plant. This is due to the deficiency of phosphorus and fixation of availability of P in the soil condition of the acidity (Billah et al., 2019). Larger response to inoculation and higher number of nodules per plant in comparison to un-inoculated treatments in a field that has no soybean cropping history was reported by (Rahim et al., 2016). This indicates suggested that inoculation does not always enhance nodulation. Improved soybean varieties (TGx 1448-2E) did not respond to inoculation in terms of nodule production in the Nigeria’s moist savanna zone (Adjei-Nsiah et al., 2019).
However, P rates and their interaction with inoculation did not significantly (P=0.25) affect the number of effective nodules. The non-responsiveness of the number of effective nodules due to P application might be described to the high P fixation of the soil. Besides, iron, which is deficient in alkaline soils, plays vital role in leghemoglobin formations, which render pink or red color to nodules.
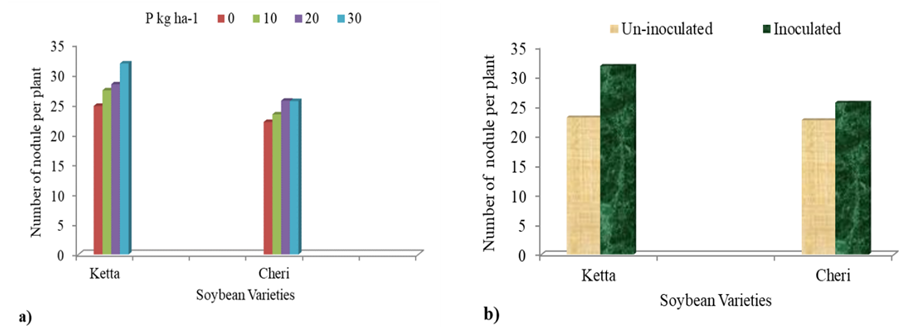
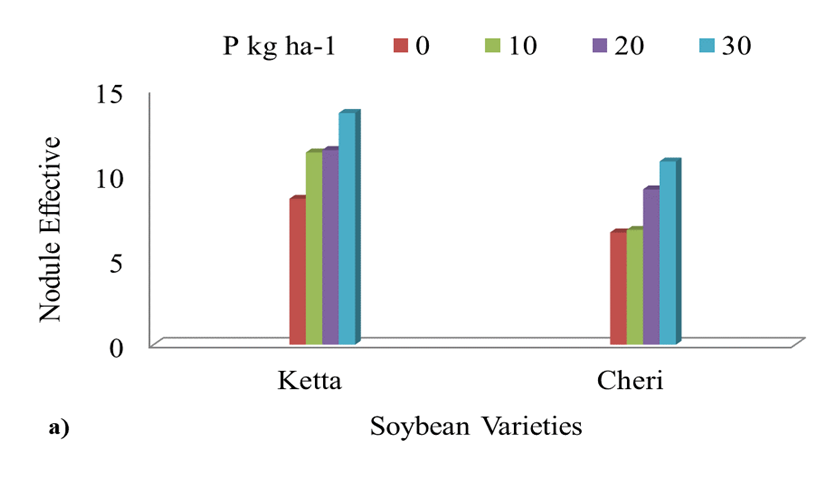
Fig. 4a: Interaction effects of variety × phosphorus
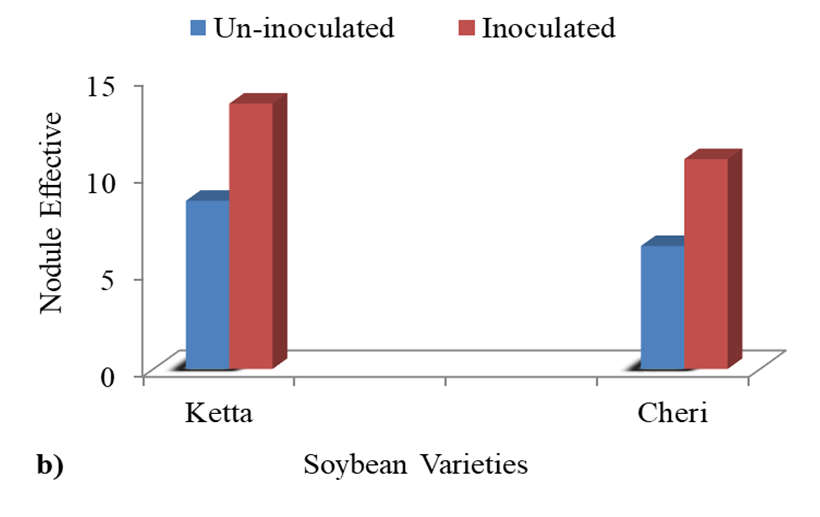
Fig. 4b: Interaction effects of variety × BradyRhizobium inoculation on effective nodule per plant
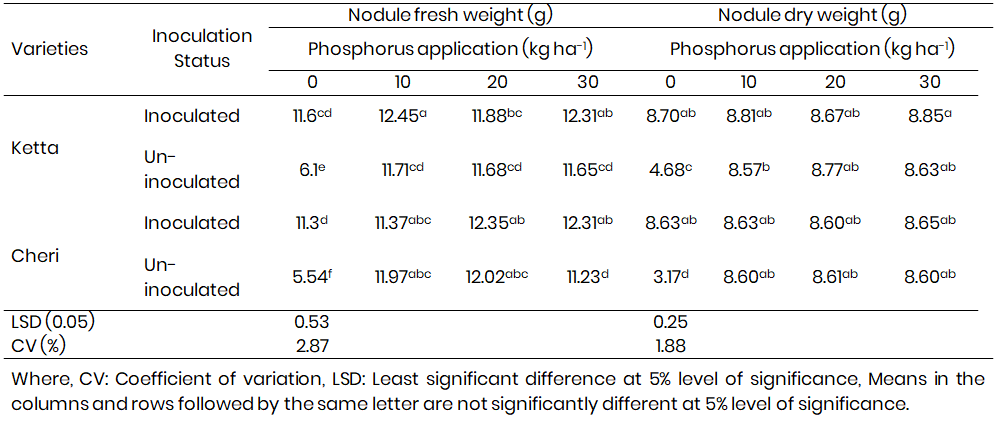
Nodule fresh weight
For the variety Ketta, inoculated plants generally had higher nodule fresh weights compared to un-inoculated plants across different levels of phosphorus application The difference in nodule fresh weight between inoculated and un-inoculated plants was statistically significant at most phosphorus application levels. The highest nodule fresh weight for Ketta was observed in the inoculated group 12.45 g at 10 kg ha-1 phosphorus application. For the variety Cheri, a similar trend was observed with inoculated plants showing higher nodule fresh weights compared to un-inoculated plants at most phosphorus application levels. The difference in nodule fresh weight between inoculated and un-inoculated plants was statistically significant at some phosphorus application levels. The highest nodule fresh weight for Cheri was observed in the inoculated group 12.35 g at 20 kg ha-1 phosphorus application, whereas the lowest nodule fresh weight of 5.54 g plant-1 were found on variety Cheri under no inoculated and control plot of P application conditions. The variety that produced the highest nodule fresh weight showed more than 55.5% increase over the variety that produced the lowest nodule fresh weight (Table 8).
In line the number and fresh weight of nodules are commonly used as the criteria of effective complementary between macro and micro with the rate of atmospheric nitrogen fixation (Tarekegn and Kibret, 2017). Similarly, reported that a simple relationship a rises between nodule number and nodule fresh weight and they are indices of nitrogen fixation (Sanyal et al., 2020).
Nodule dry weight
Similar to nodule fresh weight, inoculated plants generally exhibited higher nodule dry weights compared to un-inoculated plants for both varieties across different levels of phosphorus application. The difference in nodule dry weight between inoculated and un-inoculated plants was statistically significant at most phosphorus application levels. The highest nodule dry weight for both Ketta and Cheri was observed in the inoculated group 8.85 and 8.65 g at 30 kg ha-1 phosphorus application respectively, while, the lowest nodule dry weight per plant (3.17 g) was produced by the variety Cheri under no rhizobia inoculation and under control plot of P application (Table 8), which was about 179.17% of nodule dry weight reduction over the variety that produced the highest nodule dry weight. The reason might be due to the overall improvement in the performance of the plant in response to phosphorus fertilizer and inoculation, leading to better nodulation underlines phosphorus has on nodule development through its basic function of as an energy source. In soybean production, phosphorus and inoculation with the appropriate rhizobia strain have quite prominent effects on nodule number, dry weight and yield components. Similarly, a combination of 50 kg P2O5 ha-1 and STM3043 rhizobia strain gave the best nodule dry weight of 4.97 g plant-1 (Zoundji et al., 2015). In the present study, however, nodule dry weight ranged between 3.17-8.85 g; where Ketta variety produced the highest nodule dry weight with the application of 30 kg P ha-1 and inoculation of Rhizobia bacteria, which is high relative to what is reported by (Zoundji et al., 2015). In agreement the phosphorus application levels with inoculation influence nodule dry weight (Tarekegn and Kibret, 2017). B. japonicum strains with P fertilizer increased the nodule dry weight (Htwe et al., 2018). Phosphorus application levels, without inoculation, did not influence nodule dry weight (Bekere and Hailemariam, 2012).
Table 8: Responses of two soybean varieties to rhizobia inoculation and rate of p
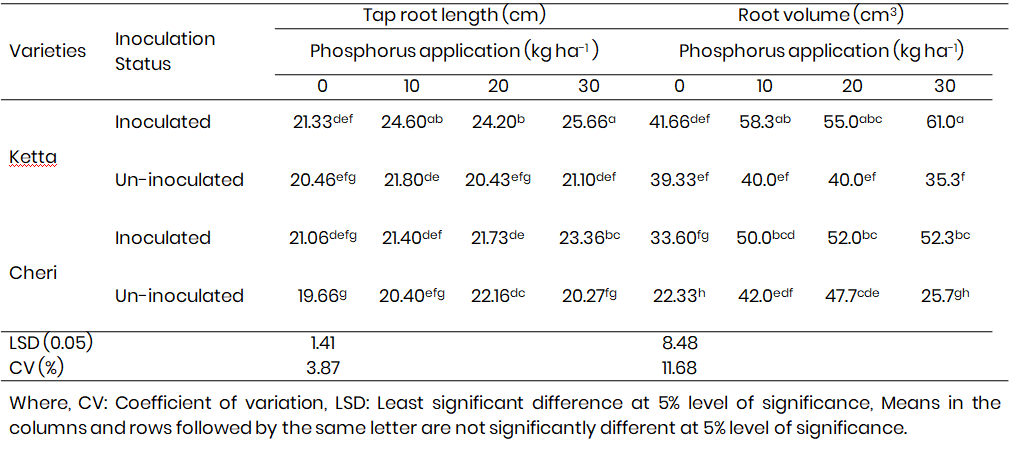
Taproot length
For the variety Ketta, inoculated plants generally had longer taproots compared to un-inoculated plants across different levels of phosphorus application. The difference in taproot length between inoculated and un-inoculated plants was statistically significant at some phosphorus application levels. The longest taproot length for Ketta was observed in the inoculated group 25.66 cm at 30 kg ha-1 phosphorus application. For the variety Cheri, a similar trend was observed with inoculated plants, showing longer taproots compared to un-inoculated plants at most phosphorus application levels. The difference in taproot length between inoculated and un-inoculated plants was statistically significant at some phosphorus application levels. The longest taproot length for Cheri was observed in the inoculated group 23.36 cm at 30 kg ha-1 phosphorus application, while the shortest taproot length of 19.66 cm was produced by the variety Cheri with the control of P application (Table 9). Increasing Phosphate fertilizer could be due to P treatment, which causes root cells to grow.
The highest taproot length of Cheri (23.36 cm) was recorded on un-inoculated rhizobia and 20 kg P ha-1 and the shortest taproot length (19.66 cm) of the same variety without inoculated rhizobia and control plot of P ha-1. This is due to un-inoculated rhizobia strain around the infected roots hairs which is not nutrient availability for plants is deep taproot length for nutrient absorption and the inoculated rhizobia and phosphorus application is fixation of nitrogen and nutrient availability which is used for vegetative growth and developments rather than taproot length. There was a significant difference level of phosphate rate for taproot length in this study, and other studies reported that systems with large root surface length and density ensures P uptake efficiency, on soils of low P availability (Battini et al., 2017). The average increase in root length by 41% as compared to un-inoculated control, due to rhizobia inoculation and phosphorus application (Dabesa and Tana, 2021a). Similarly, phosphate stimulates root growth, and it is associated with early crop maturity (Fathi and Mehdiniya, 2023).
Root volume
In terms of root volume, inoculated plants generally had higher root volumes compared to un-inoculated plants for both varieties across different levels of phosphorus application. The difference in root volume between inoculated and un-inoculated plants was statistically significant at most phosphorus application levels. The highest root volume for Ketta was observed in the inoculated group 61.0 cm3 at 30 kg ha-1 phosphorus application.
Similarly, the highest root volume for Cheri was observed in the inoculated group 52.3 cm3 at 30 kg ha-1 phosphorus application, while the lowest root volume of 22.33 cm3 was produced by the variety Cheri with the inoculation of Rhizobium bacteria and at the control plot of P application. The variety that produced the highest root volume showed 63.39% increase over the variety that produced the lowest root volume. Phosphate application and inoculation of soybean increased root volume and root biomass, due to the increased rate of nitrogen fixation. Similarly, increasing P2O5 application up to 150 kg ha-1 increases root volume (Masood et al., 2011). The application of 30 kg P2O5 ha-1 has increased the root volume by 63.39 and 36.79% under inoculated and un-inoculated conditions, respectively; while the application of 20 kg P2O5 ha-1 has increased root volume by 55.4 and 53.14 %, respectively and the application of 10 kg P2O5 ha-1 has increased root volume by 61.71% and 46.83% over the control plot of P application (Table 9).
Table 9: Responses of two soybean varieties to rhizobia inoculation and rate of phosphorus application for root volume and tapr
Effect of BradyRhizobium inoculation and P application rate on yield and yield components of Soybean varieties
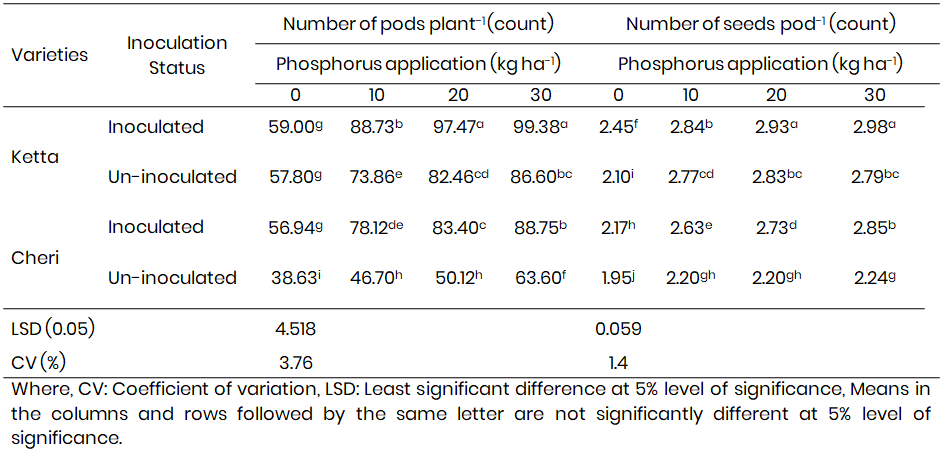
Number of pods plant-1
For the variety Ketta, plants that were inoculated generally had a higher number of pods per plant compared to un-inoculated plants across different levels of phosphorus application. The number of pods per plant increased with increasing levels of phosphorus application for both inoculated and un-inoculated plants of variety Ketta. The difference in the number of pods per plant between inoculated and un-inoculated plants was statistically significant at some phosphorus application levels. The highest number of pods per plant for Ketta was observed in the inoculated group 99.38 at 30 kg ha-1 phosphorus application. For the variety Cheri, a similar trend was observed with inoculated plants showing a higher number of pods per plant compared to un-inoculated plants at most phosphorus application levels. The number of pods per plant also increased with increasing levels of phosphorus application for both inoculated and un-inoculated plants of variety Cheri. The difference in the number of pods per plant between inoculated and un-inoculated plants was statistically significant at most P application levels. The highest number of
pods per plant for Cheri was observed in the inoculated group 88.75 at 30 kg ha-1 phosphorus application, while the lowest number of pods per plant (38.63) was produced by the variety Cheri with un- inoculated and the control plot of P application, which showed about 157.26% of pod number decrease over the variety and amendment that produced the highest pod number (Table 10).
Phosphorus applications at the rate of 10, 20 and 30 kg P ha-1 increased number of pods per plant by 54.46, 60.36 and 61.12% respectively, over the unfertilized control. This result support with that the higher numbers of pods per plant were produced in response to higher doses of phosphorus (Aryal et al., 2021). This result revealed increased number of pods per plant with increased rate of phosphorus application. This result is similar reported increased number of pods per plant in soybean following the application of P at the rate of 0, 10, 20 and 30 kg P ha-1 (Ikeogu and Nwofia, 2013).
One study that reported a similar result is effect of phosphorus application on soybean yield and quality. In this study, they found that increasing phosphorus application rates led to a higher number of pods per plant in soybean (Ferreira et al., 2018). Similarly, significant increase in the number of pods plant-1, due to the interaction effect of rhizobia strain IRJ 2180A with the application of 50 kg of P2O5 ha-1 over the control (Zoundji et al., 2015). In general, mean pod number plant-1 enhanced due to the combined effect of rhizobia inoculation and phosphorus application.
Number of seeds pod-1
For the variety Ketta, when inoculated, there is a clear trend of increasing number of pods per plant with increasing phosphorus application rates (0 kg P ha-1 to 30 kg P ha-1). Similarly, the number of seeds per pod also increases with higher phosphorus application rates. The highest values are observed (2.98) at the highest phosphorus application rate of 30 kg P ha-1 For the variety Cheri, similar trends was observed with increasing phosphorus application rates leading to higher number of pods per plant and seeds per pod, especially when the plants was inoculated. Comparing the inoculated and un-inoculated plants, it is evident that inoculation generally results in higher numbers of pods per plant and seeds per pod across both varieties and phosphorus application rates. In terms of the number of seeds per pod, plants that were inoculated generally had a higher number of seeds per pod compared to un-inoculated plants for both varieties across different levels of phosphorus application. The number of seeds per pod increased with increasing levels of phosphorus application for both inoculated and un-inoculated plants of both varieties.
The difference in the number of seeds per pod between inoculated and un-inoculated plants was statistically significant at some phosphorus application levels. The lowest number of seeds per pod (1.95) under un-inoculated rhizobia and control plot of P application of Cheri variety (Table 10). The number of seeds per pods perceived as a significant constituent that directly contributes to the recovery of potential yield in leguminous crops, like soybean (Devi et al., 2013). The number of seeds pod-1 significantly varied between genotypes. In agreement reported significant difference in number of seeds per pods after varying p rates (Alemu et al., 2018).
Table 10: Responses of two soybean varieties to rhizobia inoculation and rate of phosphorus application for
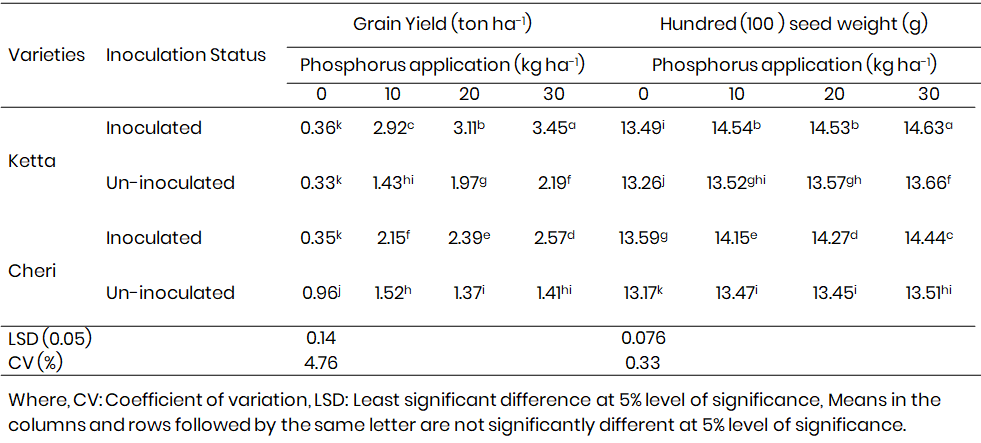
Grain yield
The highest grain yield was obtained by Ketta variety (3.45 ton ha-1) and Cheri variety (2.57 ton ha-1) under both rhizobia inoculation and application of 30 kg P ha-1 (Table 11). At the rate of 30 kg P ha-1 application, the yield of the highest yielding variety Ketta with rhizobia inoculation showed 64.35% increase over the un-inoculated control. Though, the difference in percentage increase was high, this finding supports grain yield can increase by 40-70%, when the proper rhizobia bacteria is inoculated (Gebremariam and Tesfay, 2021). The highest grain yield (3.45 ton ha-1) obtained from study was moderate relative to the national average 2.43 ton ha-1 (CSA 2021/2022) and the productivity in the study area i.e., in Bedele zone, which is 2.07 ton ha-1 (2021/2022), which indicates that the production and productivity of soybean can be increased significantly through rhizobia inoculation and application of phosphorus. The result is also in agreements the varietal difference in rice and soybean with rhizobia inoculation and phosphorus application, respectively (Adediran, 2019). Ketta variety showed grain yield increase of 38.7, 42.44 and 48.12 % at P application rates of 10, 20 and 30 kg P ha-1 respectively over the control plot of P application.
Similarly, Phosphorus applications at the rate of 22.5 and 45.0 kg P2O5 ha-1 increased grain yield by 33.9 and 35.4%, respectively, over the unfertilized control in Ghana (Davies, 2014). The seed yield of soybean increased in response to the application of phosphorus fertilizer at the rates of 20, 40 and 60 kg P2O5 ha-1 (Atnafu et al., 2020).
In line with the combined application of rhizobia inoculation and p application resulted in 21% increased grain yield (Abbasi et al., 2010). Adequate phosphorus application and rhizobia will lead to effective pod dry matter accumulation and subsequently to higher grain yield. Similarly, reported that P application with rhizobia inoculation significantly increased pod number, grain yield and dry matter yield, compared to un-inoculated treatment (Tarekegn and Kibret, 2017). The average grain yields recorded from the present study were lower, when compared to the yield of 7610 kg ha-1 obtained (Zoundji et al., 2015). However, the yield obtained from this study were comparable with the average soybean yields (770-3380 kg ha-1) reported (Zoundji et al., 2015).
Hundred seed weight
The hundred-seed weight for both varieties generally increased with higher levels of phosphorus application. Inoculated plants tended to have higher hundred-seed weights compared to un-inoculated plants, especially at higher levels of phosphorus application.
Ketta variety had the highest hundred seed weight (14.63 g) under rhizobia inoculated and 30 kg P ha-1 application, followed by (14.54 g) under rhizobia inoculated 10 kg P ha-1 and (14.53 g) of the same soybean variety, while the lowest hundred seed weight (13.17 g) was recorded on Cheri variety under rhizobia un-inoculated and control plot of P application (Table 11). The interaction effect of inoculation and P rates on hundred seeds weight was very highly significant increased (P<0.0001). This could be due to combined application of rhizobia and N2 fixation which supplied by biological compounds that play major roles in photosynthesis which eventually increased seeds weight.
Generally, the results suggest that phosphorus application plays a significant role in enhancing grain yield and seed weight in soybean varieties, with inoculation showing a positive impact on plant performance. The data indicates the importance of phosphorus management and inoculation strategies in optimizing soybean production for better yields and seed quality. Interaction effect of the factors under study 50 (I × P) on 1000-seed weight was significantly reported (Ngalamu et al., 2013). Also increasing P levels from 0 to 69 kg P2O5 ha-1 showed increase in thousand seeds weight, the highest thousand seeds weight (20.5 and 20.4 g) were scored at 23 and 69 kg P2O5 ha-1 application, respectively. Significant increase of thousand seeds weight by 5-18% due to P application from 20 to 80 kg P ha-1 over the control treatment (Fituma et al., 2018).
The Ketta variety that produced the highest hundred seed weight showed hundred seed weight increase of 9.98% P application over the variety that produced the lowest seed weight. In agreement with this result, Significant difference among soybean varieties for hundred seed weight, in which the highest hundred seed weight was produced by the variety BFS 39 and the lowest hundred seed weight was recorded by the variety Roba (Imenu et al., 2022).
Table 11: Responses of two soybean varieties to rhizobia inoculation and rate of phosphorus application for
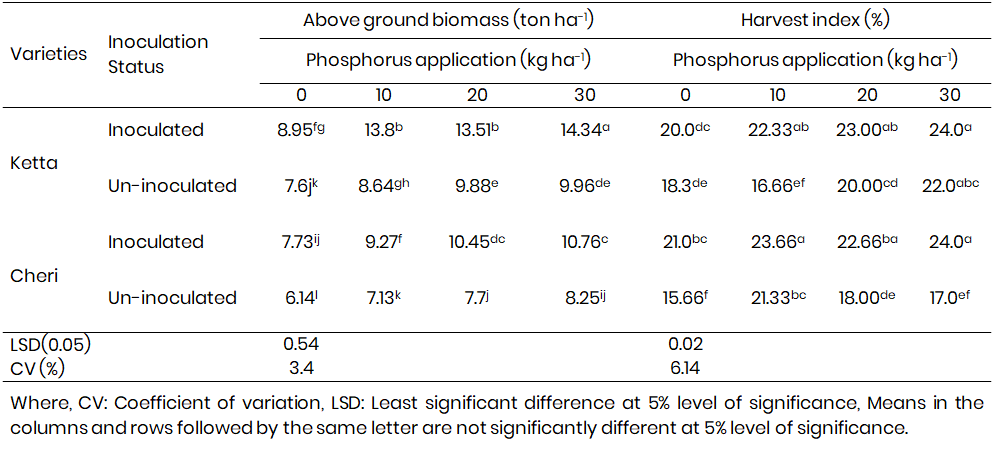
Above ground biomass
The data shows that for the variety Ketta, the highest above ground biomass was observed 14.34 ton ha-1 at 30 kg ha-1 of phosphorus application for both inoculated and un-inoculated conditions. In general, inoculated plants tended to produce higher above ground biomass compared to un-inoculated plants across different levels of phosphorus application. Variety Cheri also displayed higher the highest above ground biomass with increasing levels of phosphorus application, especially for the inoculated plants; while the lowest above ground biomass yield (6.14 ton ha-1) was recorded on variety Cheri under un-inoculated and the control main plots (no phosphorus), which was lower by about 54.18% over the variety that produced above ground biomass yield. The phosphorus application rate had very highly significantly (P<0.0001) affected above ground biomass of soybean. Phosphorus application of 10, 20 and 30 kg P ha-1 increased above ground biomass yields by 31.57, 33.75 and 37.59%, respectively, over the control plots of Ketta variety (Table 12). The application of 25 and 35 kg P ha-1 increased the soybean above ground biomass yields by 54 and 70%, respectively, over the control plots (Phiri et al., 2016).
The above ground biomass increased, due to the three way interaction effects of 30 kg P ha-1 application and inoculated rhizobia strain of Ketta variety. This might be due to the development of root system that might have increased water and nutrient uptake, and consequently, increased photosynthesis, and production of photosynthetic material that might have resulted in increased biological yield. In line phosphate application and inoculation of B. japonicum to legumes, as soybean increased plant biomass, due to increased rate of nitrogen fixation (Houngnandan et al., 2020).
Harvest index
The harvest index for both varieties generally increased with higher levels of phosphorus application. Inoculated plants tended to have a higher harvest index compared to un-inoculated plants, especially at higher levels of phosphorus application.
Ketta and Cheri varieties resulted in significantly higher harvest index (24%) under rhizobia inoculated and 30 kg ha-1 P application and lowest values of harvest index (15.66%) was obtained under un-inoculated and control plot of P application of Cheri variety (Table 12). Phosphate fertilizer application increases the number of nodule and size and grain formation due to increased nitrogen fixation. This can be explained by a good symbiotic activity induced by the strain of rhizobia and the host plant. The highest harvest index implies the higher partitioning of dry matter in grain. Whereas, the lowest harvest index (15.66%) gained from unfertilized plot.
Generally, the results suggest that phosphorus application has a significant impact on the above ground biomass production and harvest index of soybean varieties. Inoculation also plays a role in enhancing above ground biomass and harvest index values. These findings indicate the importance of phosphorus management and inoculation strategies in optimizing soybean production for better biomass yield and harvest index percentages.
In line the values of harvest index showed an increasing trend in the harvest index values with application of phosphorus Rhizobia inoculation is known to increase the yields of soybean of harvest index by way of increasing the nodulation and biomass of root and shoot (Houngnandan et al., 2020). In agreement inoculation of SB6 B1 and legume fix recorded significantly higher harvest indices of 54 and 53% over un-inoculated plot (Fituma, 2015). Soybean seeds inoculation increased the nodule number per plant and thus increasing harvest index by 3.36% (Tekola et al., 2018).
Table 12: Response of two soybean varieties to rhizobia inoculation and rate of phosphorus application for above ground bioma
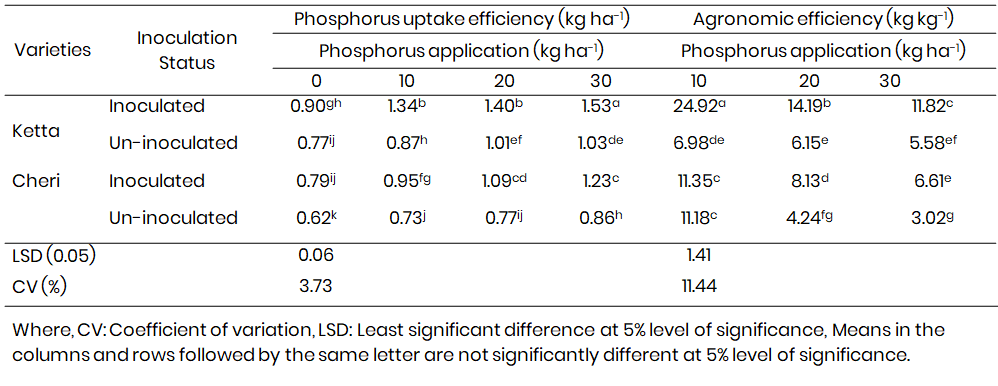
Phosphorus uptake efficiency
For the variety Ketta, the phosphorus uptake efficiency increased with higher phosphorus application rates for both inoculated and un-inoculated conditions. The highest phosphorus uptake efficiency was observed 1.53 kg ha-1 at 30 kg ha-1 P for the inoculated treatment.
For the variety Cheri, a similar trend was observed with an increase in phosphorus uptake efficiency with higher phosphorus application rates for both inoculated and un-inoculated conditions. The highest phosphorus uptake efficiency was also observed 1.23 kg ha-1 at 30 kg ha-1 P for the inoculated treatment (Table 13). The lowest GUP of 0.62 kg ha-1 was produced under un-inoculated and the control main plot (no phosphorus) by the variety Cheri. The increased PUE due to added supply of nutrients might enhance absorption of water and nutrients. In agreement with the findings, application of 46 kg P ha-1 and inoculation with B. japonicum increased P uptake by 18.78% compared to the un-inoculated treatment (Tarekegn and Kibret, 2017). Increased in P content of the seed and P uptakes in soybean, in response to the combined application of B. japonicum inoculation reported by (Tarekegn and Kibret, 2017).
In addition, rhizobia inoculation improved grain phosphorus uptake, due to rhizobia inoculation, which might be attributed to the fact that some isolates of Rhizobium have the ability to solubilize precipitated P components and thereby, increase P uptake in plants (Dabesa and Tana, 2021a). The result of this study, clearly demonstrates that Rhizobium inoculation improves the P uptake efficiency of soybean, which might also contributes ton-increased productivity of the crop.
Significant differences was noted in PUE among the varieties between the inoculated and un-inoculated treatments, when the rate of P application increased to 10, 20 and 30 kg P ha-1, showing that Rhizobia inoculation enhanced the GPU efficiency of the responsive varieties, indicating the importance of combined application of Rhizobia inoculation together with P
Fertilization for better response. Higher rate of P application 30 kg ha-1 resulted in higher phosphorus uptake efficiency. This indicates that increasing the rate of phosphorus application to the optimum level increases phosphorus uptake efficiency. Similarly, reported that P uptake by soybean was increased with increasing levels of phosphorus (Devi et al., 2012).
Agronomic efficiency
The agronomic efficiency for both varieties and inoculation statuses showed varying trends with phosphorus application rates. For variety Ketta, the agronomic efficiency was highest 24.92 kg kg-1 at 10 kg ha-1 P for the inoculated treatment, while for variety Cheri, the highest agronomic efficiency was observed 11.35 at 10 kg ha-1 P for the inoculated treatment (Table 13).
The lowest agronomic efficiency (3.02 kg kg-1) was obtained on Cheri variety under un-inoculated and application of 30 kg ha-1 P conditions. Comparison between Inoculated and Un-inoculated Treatments: In general, inoculated treatments showed higher phosphorus uptake efficiency and agronomic efficiency compared to un-inoculated treatments for both varieties across different phosphorus application rates. The efficiency of applied phosphorus in the soil reduces, mainly due to soil erosion, leaching and gaseous losses. The utilization of nutrient decreases, when increasing the rate of nutrient application by the law of limiting factors (Atkinson et al., 2010).
This finding is in line phosphorus agronomic efficiency decrease in un-inoculated plots, but increased in the inoculated plots (Adeyemi et al., 2021). The efficiency of the applied P in this study was within the range of 31.27-3.02 kg kg-1 at the rates of 10 to 30 kg P ha-1 application, respectively (Table 13). This is lower than the one reported declining trend of agronomic efficiency on common bean from 69.8 to 9.3 kg kg-1 when the rates of P increased from 10 to 60 kg P ha-1. With the corresponding application of single super phosphate and inoculation, increased phosphorus uptake efficiency and yield with phosphorus application and rhizobia inoculation (Aziz et al., 2016).
Under tropical conditions, the efficiency of applied nutrient has been estimated to be 10-30% for phosphorus (Fageria et al., 2013). Estimates of agronomic efficiency showed that the lower level of P relatively responded better to grain yield, which is in agreement with (Qiao et al., 2022) who reported that small amount of applied fertilizer optimized nutrient uptake efficiency.
Table 13: Response of two soybean varieties to Rhizobia inoculation and rate of phosphorus application for phosphorus uptake
Conclusion
Soybean (Glycine max L.) farming in Ethiopia holds promise for enhancing food security and rural livelihoods, but nutrient deficiencies, particularly phosphorus, and soil acid is limiting factors. Nitisols in southwestern Ethiopia, characterized by high clay content and fertility potential, require specific interventions to improve soybean productivity. The symbiotic relationship between soybean plants and rhizobia bacteria plays a crucial role in nitrogen fixation, but the effective of rhizobia strains varies based on soil type and environmental conditions. The combined application of phosphorus fertilizer and compatible rhizobia strains can potentially enhance soybean growth and yield in Nitisols.
The study was conducted at Bedele district, Southwest Ethiopia with the objectives of determining the effects of P fertilizer rates on growth, nodulation and yield of soybean varieties, and grain yield of soybean, and to identifying economically feasible treatment(s) that can maximize the productivity. The treatments were laid out in a RCBD with three replications. The treatments included: rhizobia inoculation (MAR-1495 strains) and without inoculated as a control, soybean varieties Ketta (V1) and Cheri (V2) and phosphorus level (0, 10, 20 and 30 kg P ha-1) as rates of fertilizers.
The results of highlight of this study indicated that: the physical and chemical properties of soil were analyzed before planting and after harvest. After harvest the available phosphorus and total nitrogen indicated a minor increase from initial soil analysis. This means available phosphorus from 0.5 to 0.82 mg kg-1 and total nitrogen from 0.12 to 0.28% before and after respectively.
The results of this study indicated that the combined application of rhizobia strain with phosphate fertilizer resulted in highly significant and significant improvement in the studied traits i.e. flowering days, root volume, number of nodules per plant, number of pods per plant, phosphorus use efficiency, agronomic efficiency, grain yields, number of effective nodule, nodule fresh weight, nodule dry weight, days of maturity, number of seeds per pods and above ground biomass of soybean respectively. These improvements have resulted in increased grain yield and yield related parameters of soybean grown on the Nitisol of study area. The combination of inoculated rhizobia and phosphorus fertilizer application gave significantly the highest Plant height (100.40 cm), The highest leaf area (112.79 cm2) number of Nodule per plant (31.80), The highest nodule fresh weight (12.45 g), nodule dry weight (8.85 g plant-1), The longest taproot length (25.66 cm), The highest root volume (61.10 cm3), grain yield (3.45 ton ha-1), the highest hundred seed weight (14.63 g), the highest above ground biomass (14.34 ton ha-1), and grain phosphorus uptake (1.53 kg ha-1), the highest agronomic efficiency (24.92 kg kg-1) were recorded from the interaction of inoculated rhizobia and 10 kg P ha-1 of Ketta variety. Phosphorus fertilizer application of 30 kg P ha-1 with inoculated rhizobia were resulted in higher production and recommended for further evaluation. In conclusion on the combined application of rhizobia inoculation and 30 kg P ha-1 gave better nodulation and yield than the rest of the treatment and Ketta variety was tends better responds to growth parameters, nodulation and yield components on plant height, number of nodule and grain yields. Therefore, use of rhizobia strain and 30 kg P ha-1 increase nodulation, grain yield (3.45 ton ha-1) and phosphorus uptake of soybean in the study area is recommended. The application of inoculated rhizobia and 30 kg P ha-1 produced the highest net benefit 113231.2 ETB ha-1. The highest marginal rate of return (541.6%) was obtained from yield at inoculated rhizobia and 30 kg P ha-1 of Ketta soybean variety was the most profitable treatment. It has the highest return to the money invested in its production. However, the experiment was conducted for one cropping season and a single location. It is realistic to repeat similar experiment across wider ranges of agro ecology to give further recommendation. Furthermore, evaluating different types of effective and compatible rhizobia strain along with different source of phosphate to increase phosphorus utilization efficiency and grain yield of soybean should require further investigation in the future.
Therefore, the result should be verified for practical recommendation to be enhancing soybean production in the study region and Future research and agricultural practices should focus on identifying optimal treatment combinations to maximize soybean productivity in specific soil types and environmental conditions in region.
References
Abbasi, M. K., Manzoor, M. & Tahir, M. M. (2010). Efficiency of Rhizobium inoculation and P fertilization in enhancing nodulation, seed yield, and phosphorus use efficiency by field grown soybean under hilly region of Rawalakot Azad Jammu and Kashmir, Pakistan. Journal of plant nutrition,33, 1080-1102.
Adediran, O. A. (2019). Physiological responses of cowpea (Vigna unguiculata L. Walp) varieties to Rhizobia inoculation, phosphorus application and sequential cropping system in Minna, Nigeria (Doctoral dissertation, Federal University of Technology, Minna), 278 pp.
Adeyemi, N. O., Atayese, M. O., Olubode, A. A., & Akan, M. E. (2020). Effect of commercial arbuscular mycorrhizal fungi inoculant on growth and yield of soybean under controlled and natural field conditions. Journal of Plant Nutrition, 43, 487–499. https://doi.org/10.1080/01904167.2019.1679809
Adeyemi, N. O., Atayese, M. O., Sakariyawo, O. S., Azeez, J. O., Olubode, A. A., Ridwan, M., Adebiyi, A., Oni, O., & Ibrahim, I. (2021). Influence of different arbuscular mycorrhizal fungi isolates in enhancing growth, phosphorus uptake and grain yield of soybean in a phosphorus deficient soil under field conditions. Communications in Soil Science and Plant Analysis, 52, 1171–1183. https://doi.org/10.1080/00103624.2021.1917683
Adjei-Nsiah, S., Kumah, J., Owusu-Bennoah, E., & Kanampiu, F. (2019). Influence of P sources and Rhizobium inoculation on growth and yield of soybean genotypes on Ferric Lixisols of Northern Guinea savanna zone of Ghana. Communications in Soil Science and Plant Analysis, 50, 853–868. https://doi.org/10.1080/00103624.2019.1593814
Copyright
Open Access This article is licensed under a Creative Commons Attribution 4.0 International License, which permits use, sharing, adaptation, distribution and reproduction in any medium or format, as long as you give appropriate credit to the original author(s) and the source, provide a link to the Creative Commons license, and indicate if changes were made. The images or other third party material in this article are included in the article’s Creative Commons license, unless indicated otherwise in a credit line to the material. If material is not included in the article’s Creative Commons license and your intended use is not permitted by statutory regulation or exceeds the permitted use, you will need to obtain permission directly from the copyright holder. To view a copy of this license, visit http://creativecommons.org/licenses/by/4.0/

